Scheduling and the shop floor
Schedule a work order
Open the work order and choose Actions → Auto Schedule. The system plans each operation on its machine, taking account of the holiday calendar, and shows the Schedule Result: the planned window, the estimated duration and the operations as a Gantt Chart or a Table.
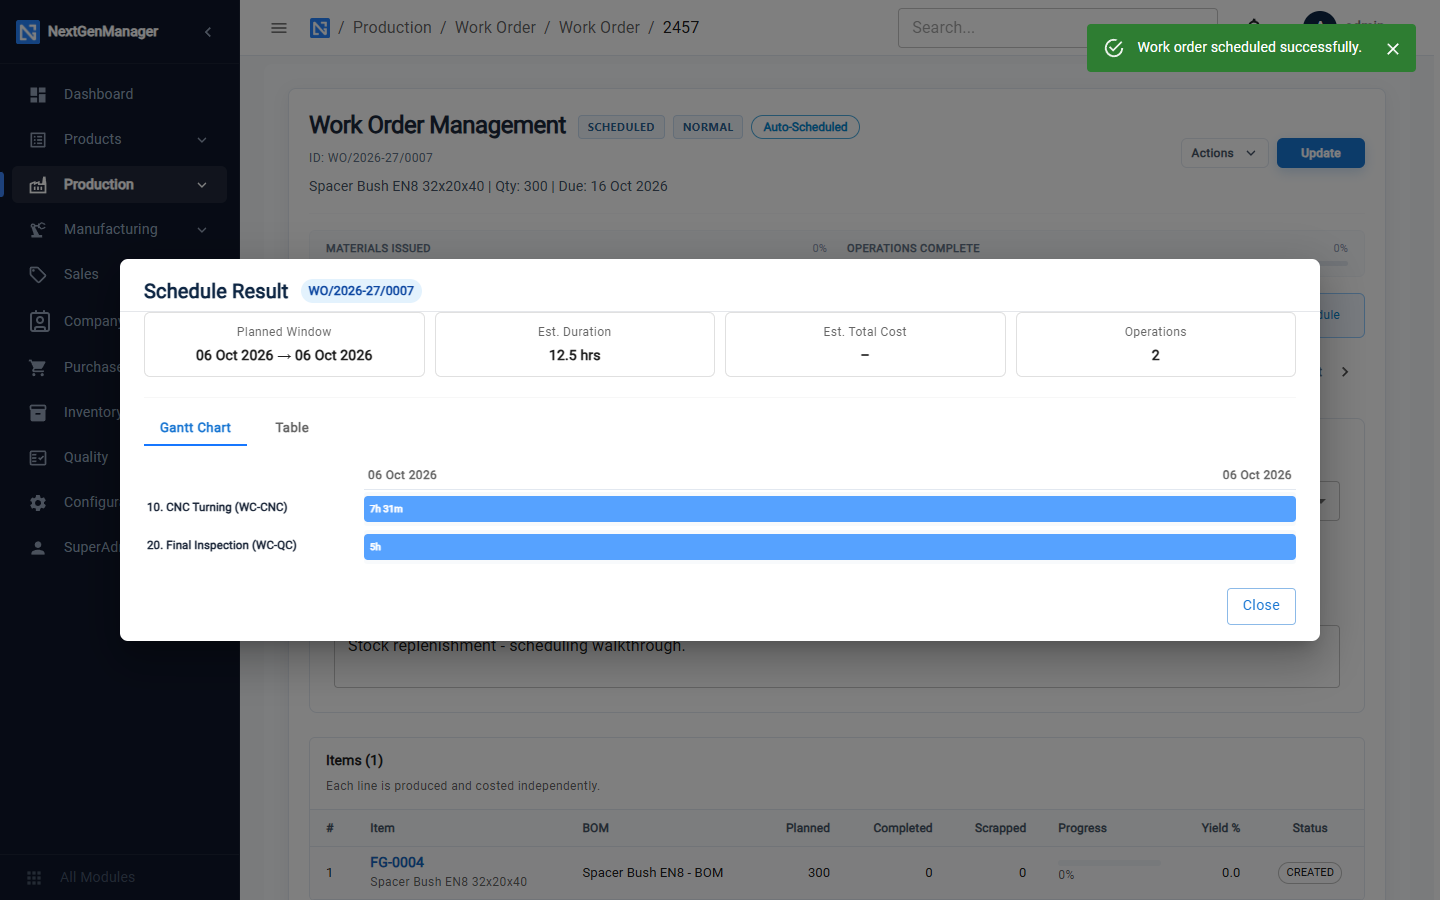
The order now shows SCHEDULED and Auto-Scheduled, with the planned dates under the header. On the Operations Log tab, switch from LIST to TIMELINE to see the bars.
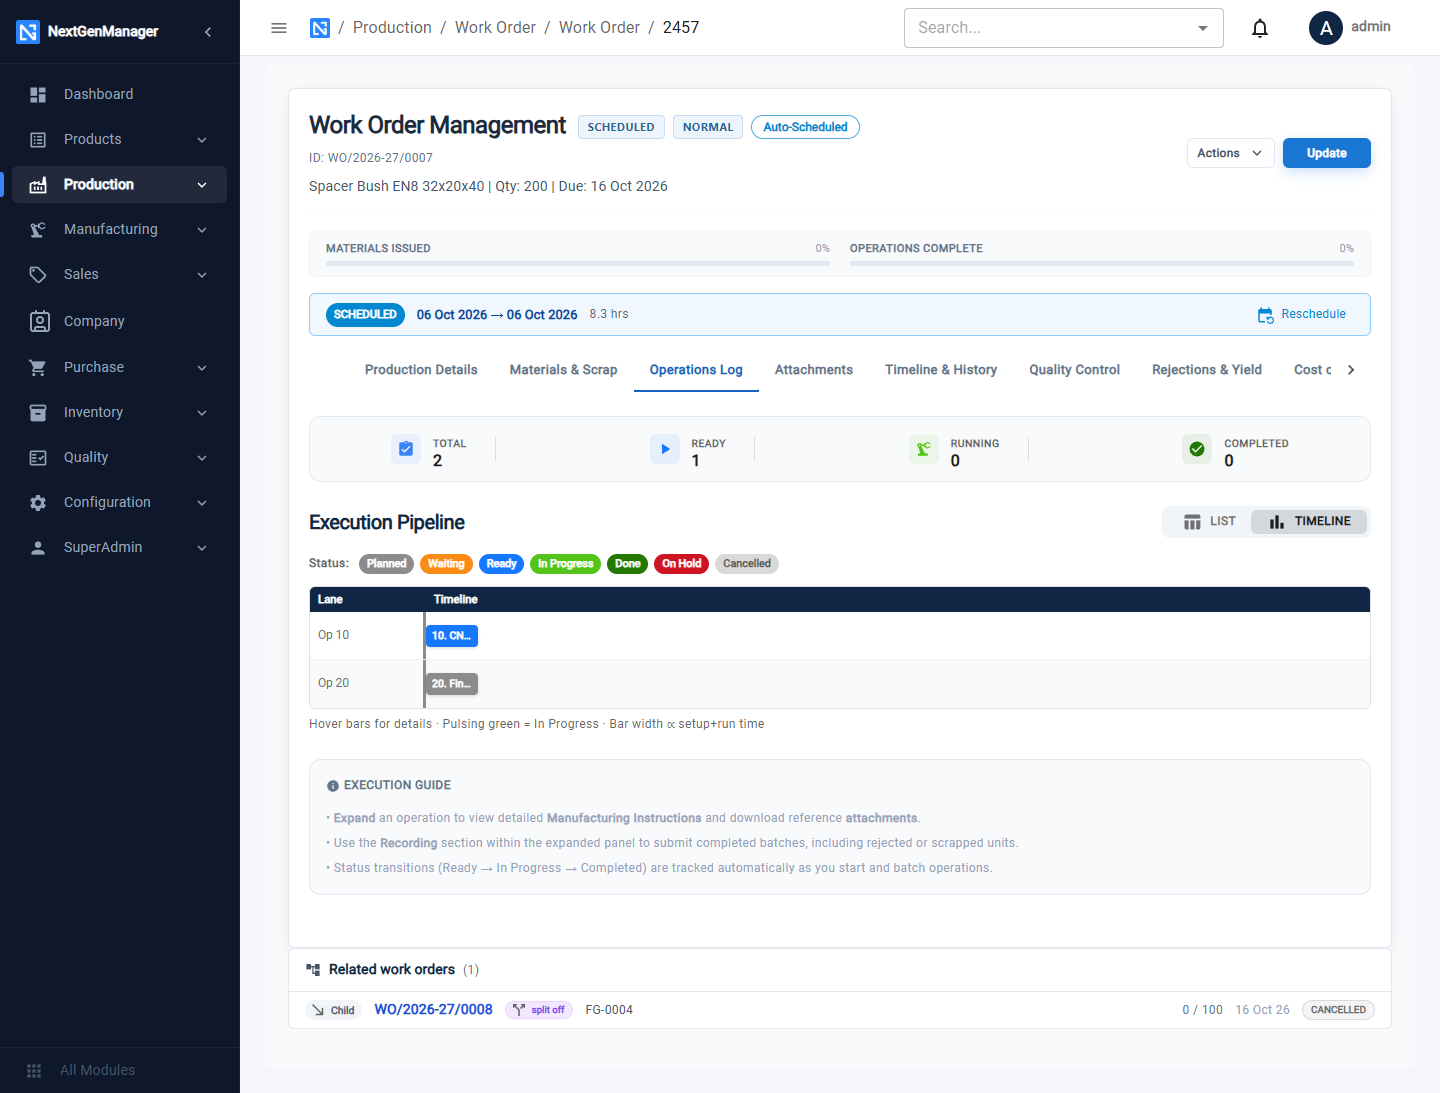
- Reschedule (in the header strip or the Actions menu) moves the order.
- Schedule All on the work-order list schedules every open order in one go.
Schedule Views
Where: Operations → Production → Schedule Views.
A week grid of the load on each work center and machine. Choose the dates at the top; filter by status and priority. The tiles show Total Operations, Completed, In Progress, Planned Time and Utilization.
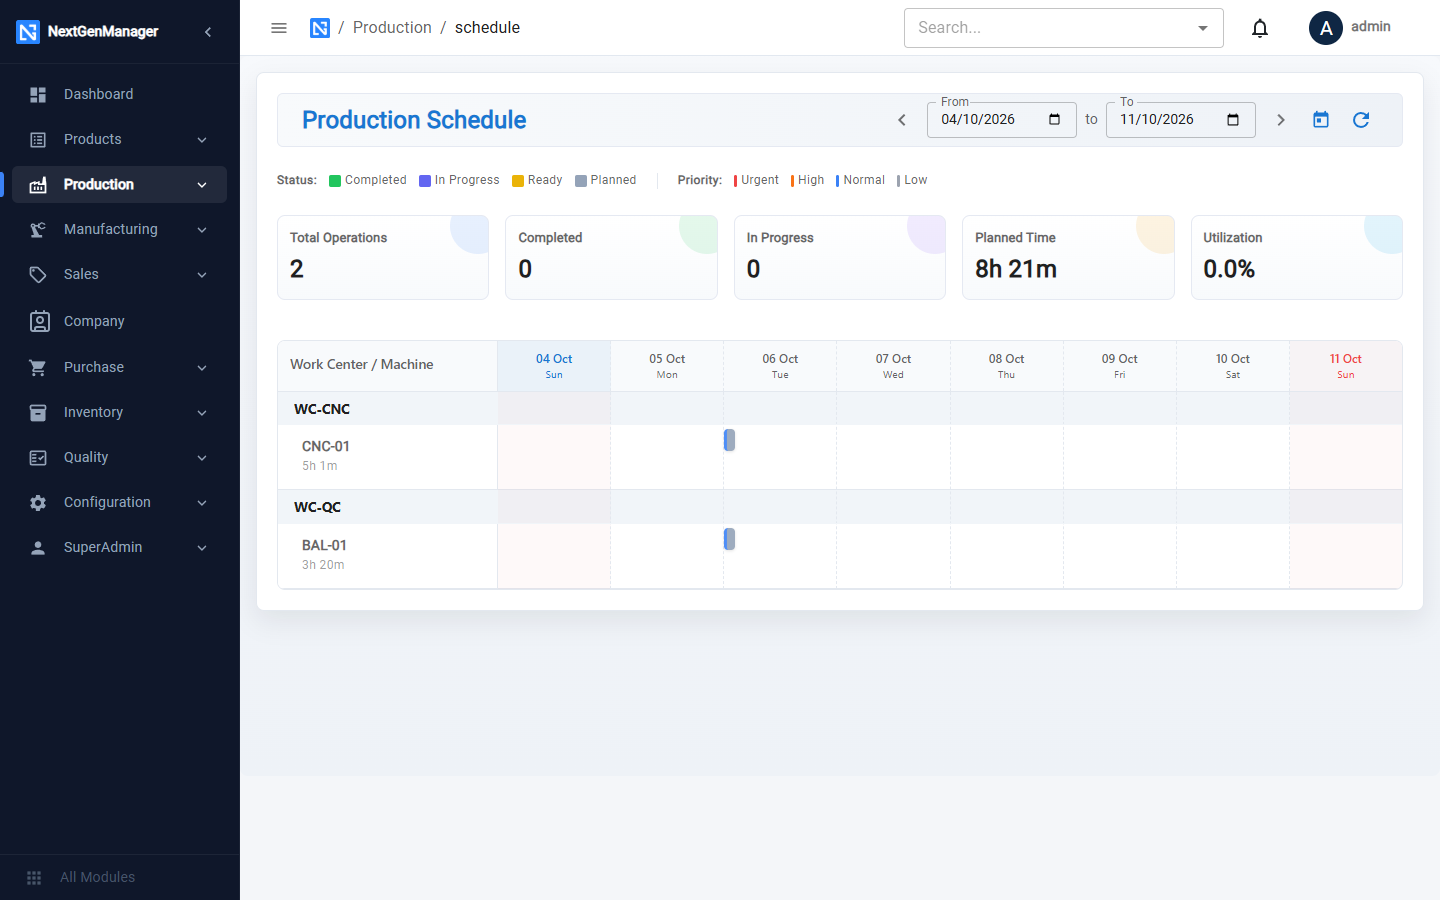
The grid is empty until work orders have been scheduled.
Split a work order
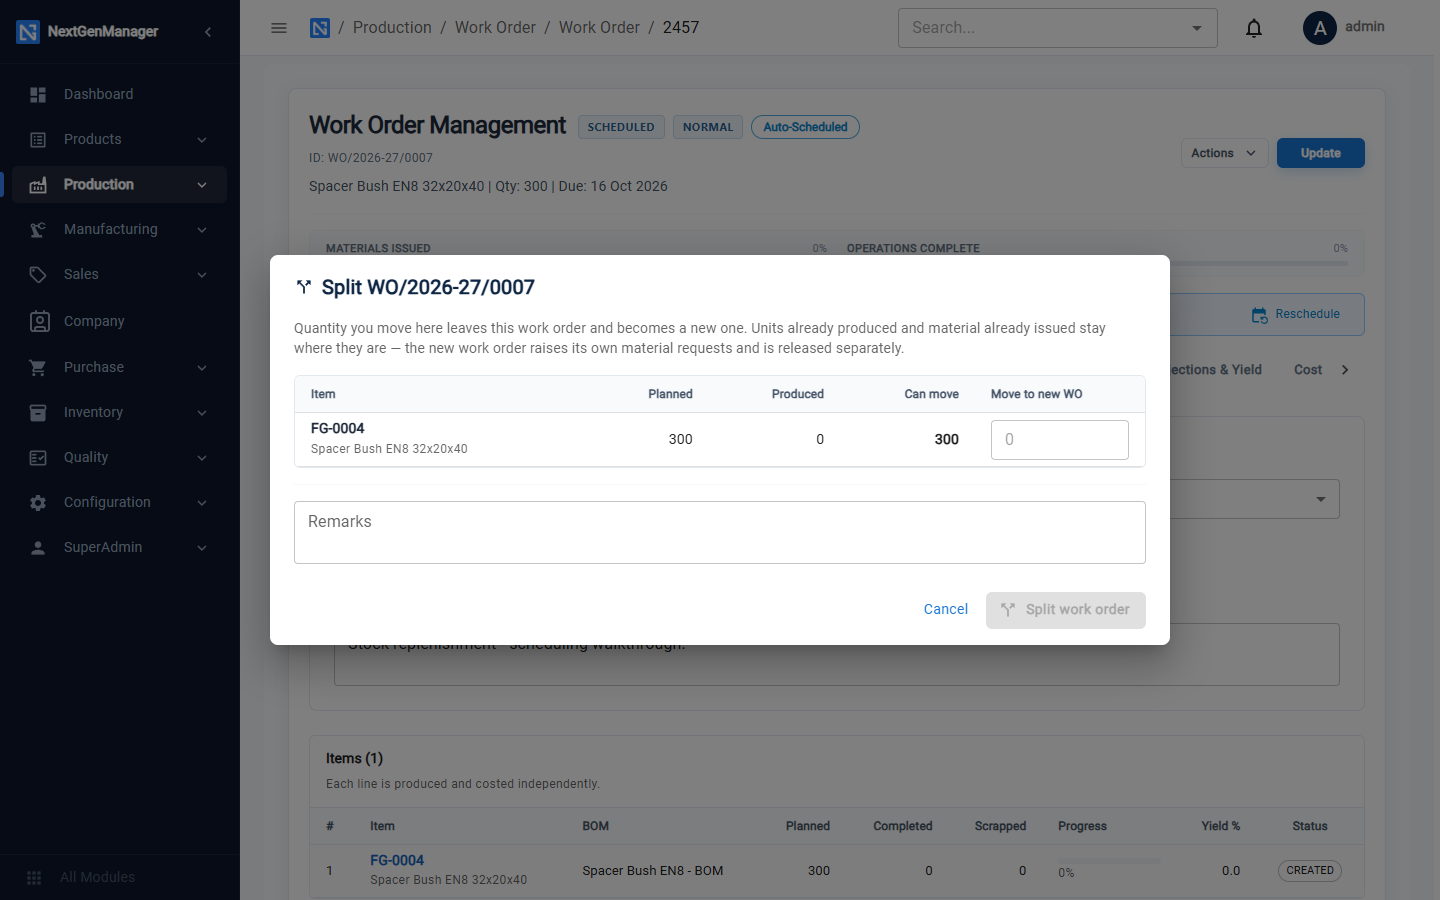
Actions → Split WO moves part of the planned quantity to a new work order. As the box says, the new work order raises its own material requests and is released separately. Use it to run part of a job now and the rest later, or on another machine.
The two orders show each other under Related work orders.
Cancel a work order
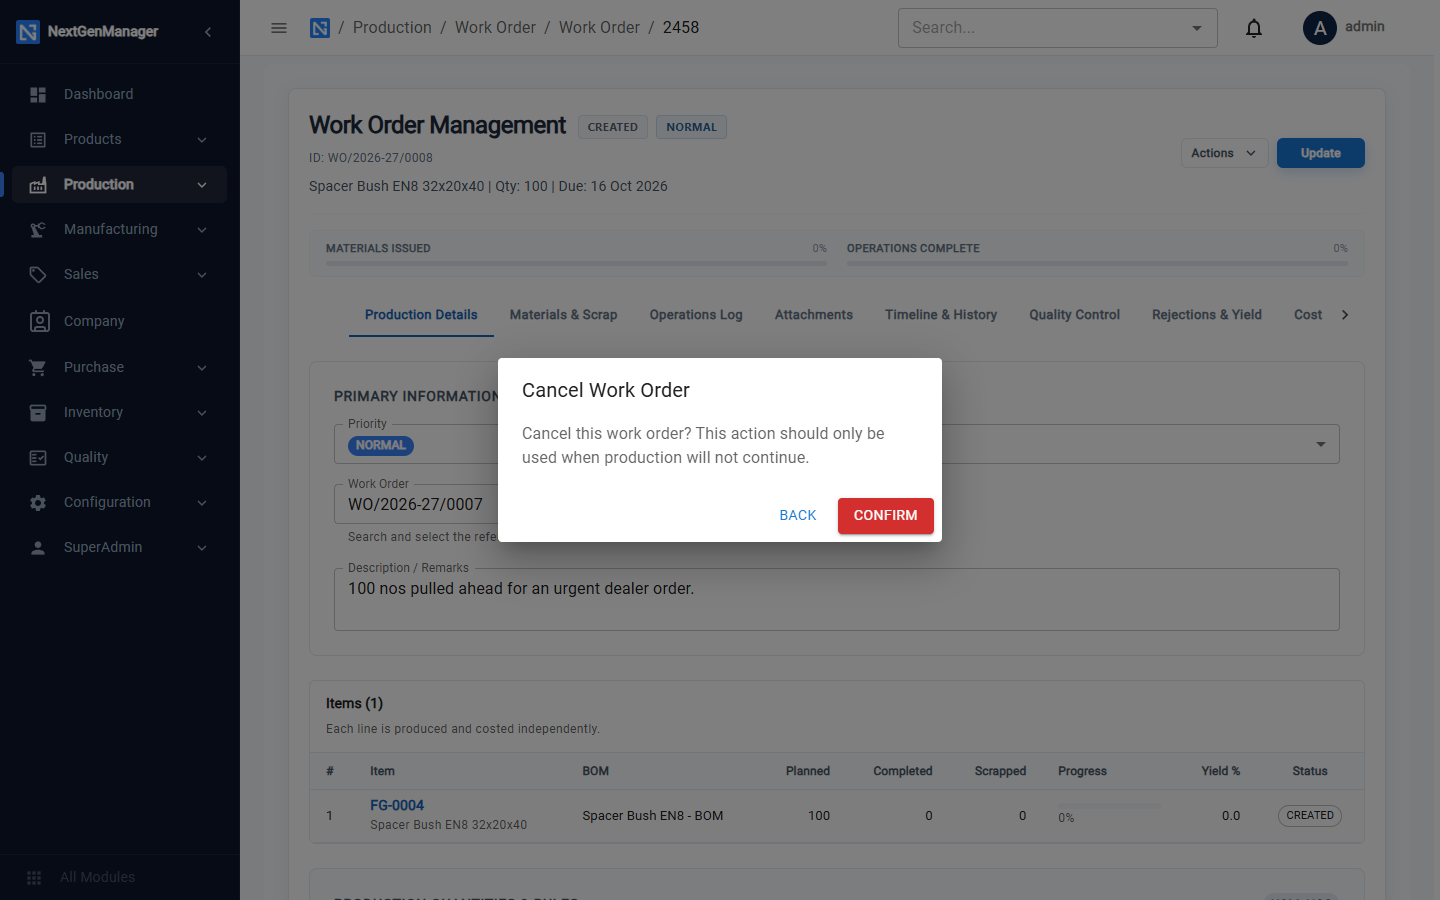
Actions → Cancel WO is for an order that will not continue. Give the reason and confirm.
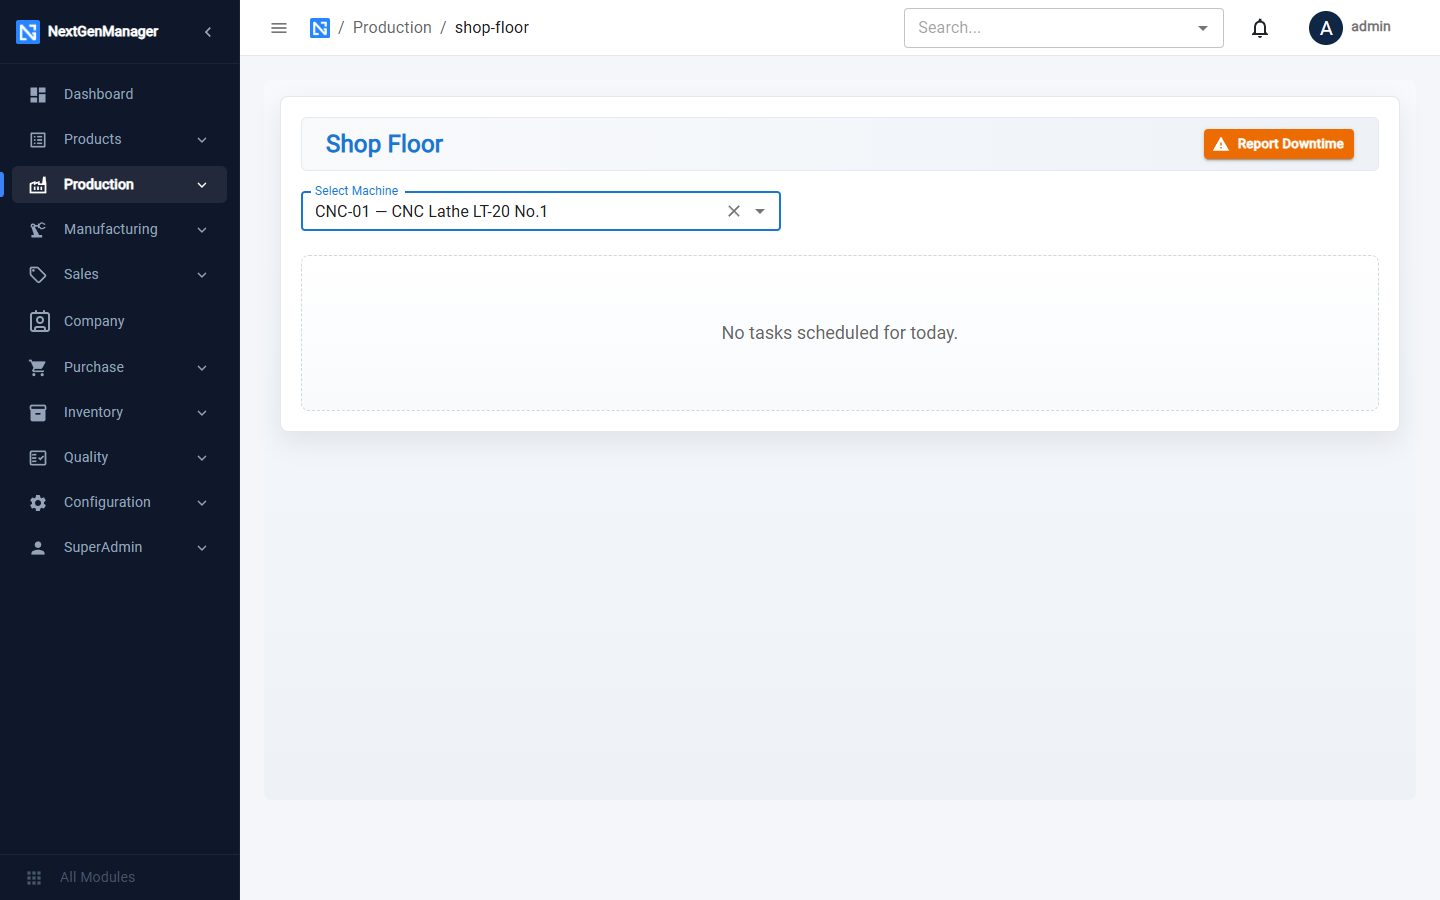
The Shop Floor screen
Where: Operations → Production → Shop Floor.
Choose a machine to see the tasks scheduled on it for today.
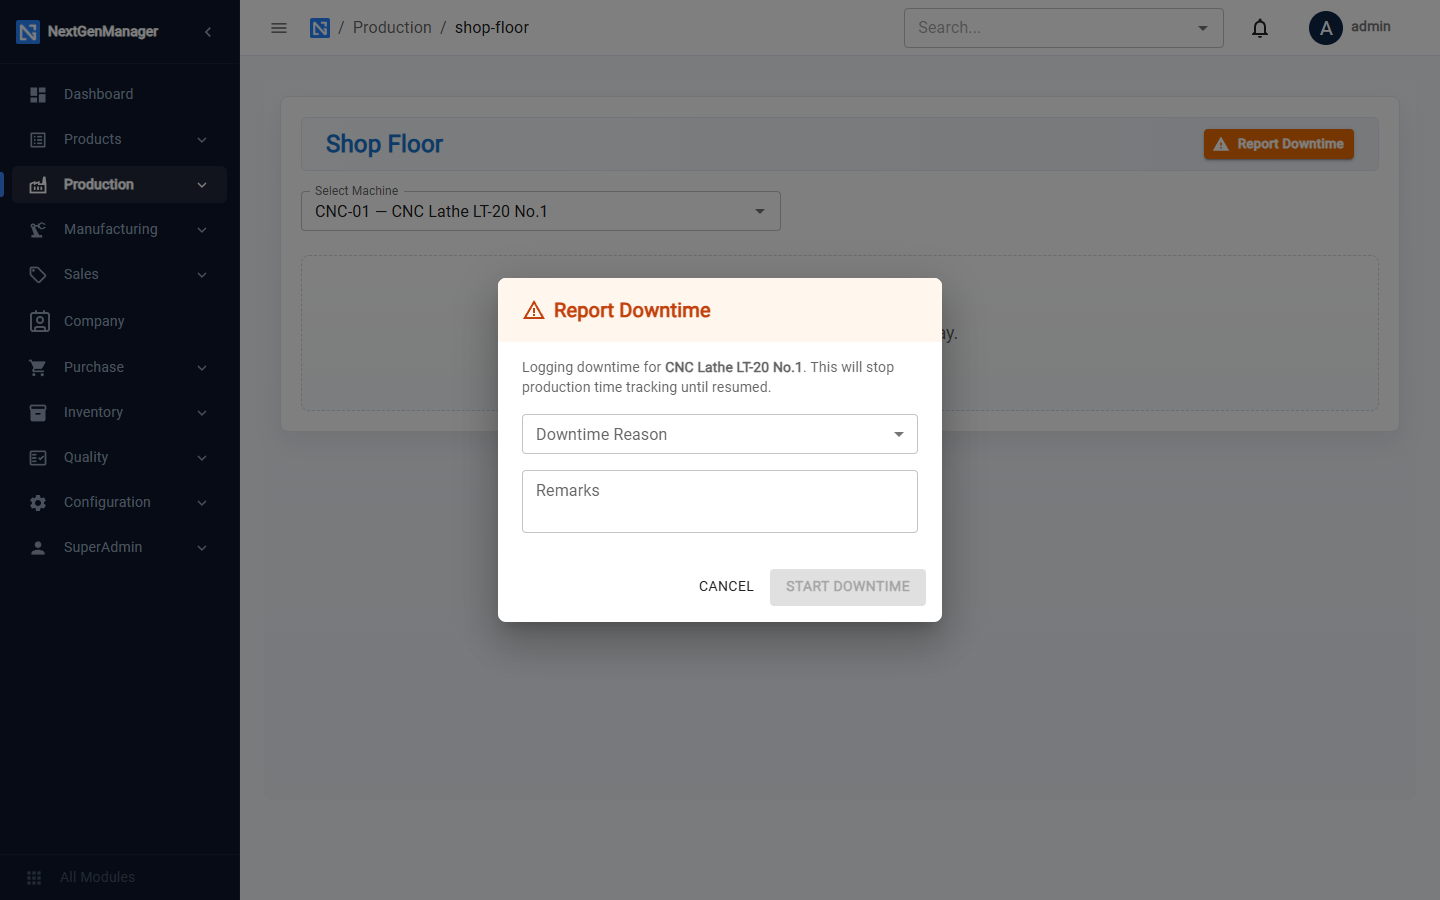
Report downtime
- Select the machine and click Report Downtime.
- Choose the Downtime Reason and add Remarks.
- Click START DOWNTIME. The box explains that this stops production time tracking until resumed.
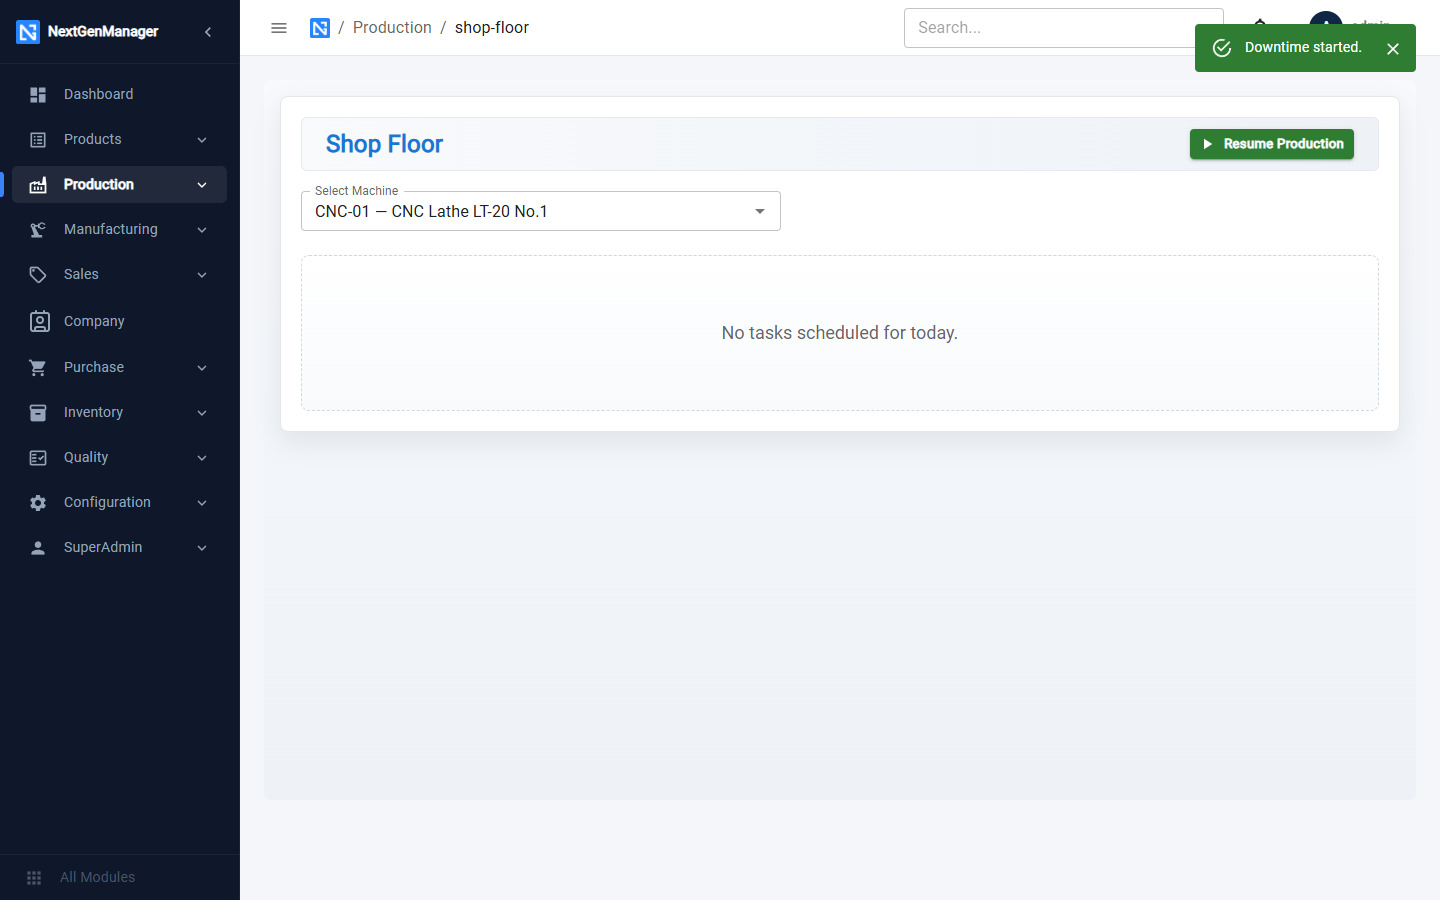
While the machine is down the button reads Resume Production. Click it when the machine is running again.
The reasons come from Downtime Reasons.
OEE Dashboard
Where: Operations → Production → OEE Dashboard.
Choose a machine to see its Overall OEE, Availability, Performance and Quality, a seven-day trend, a Pareto chart of downtime causes and production statistics.
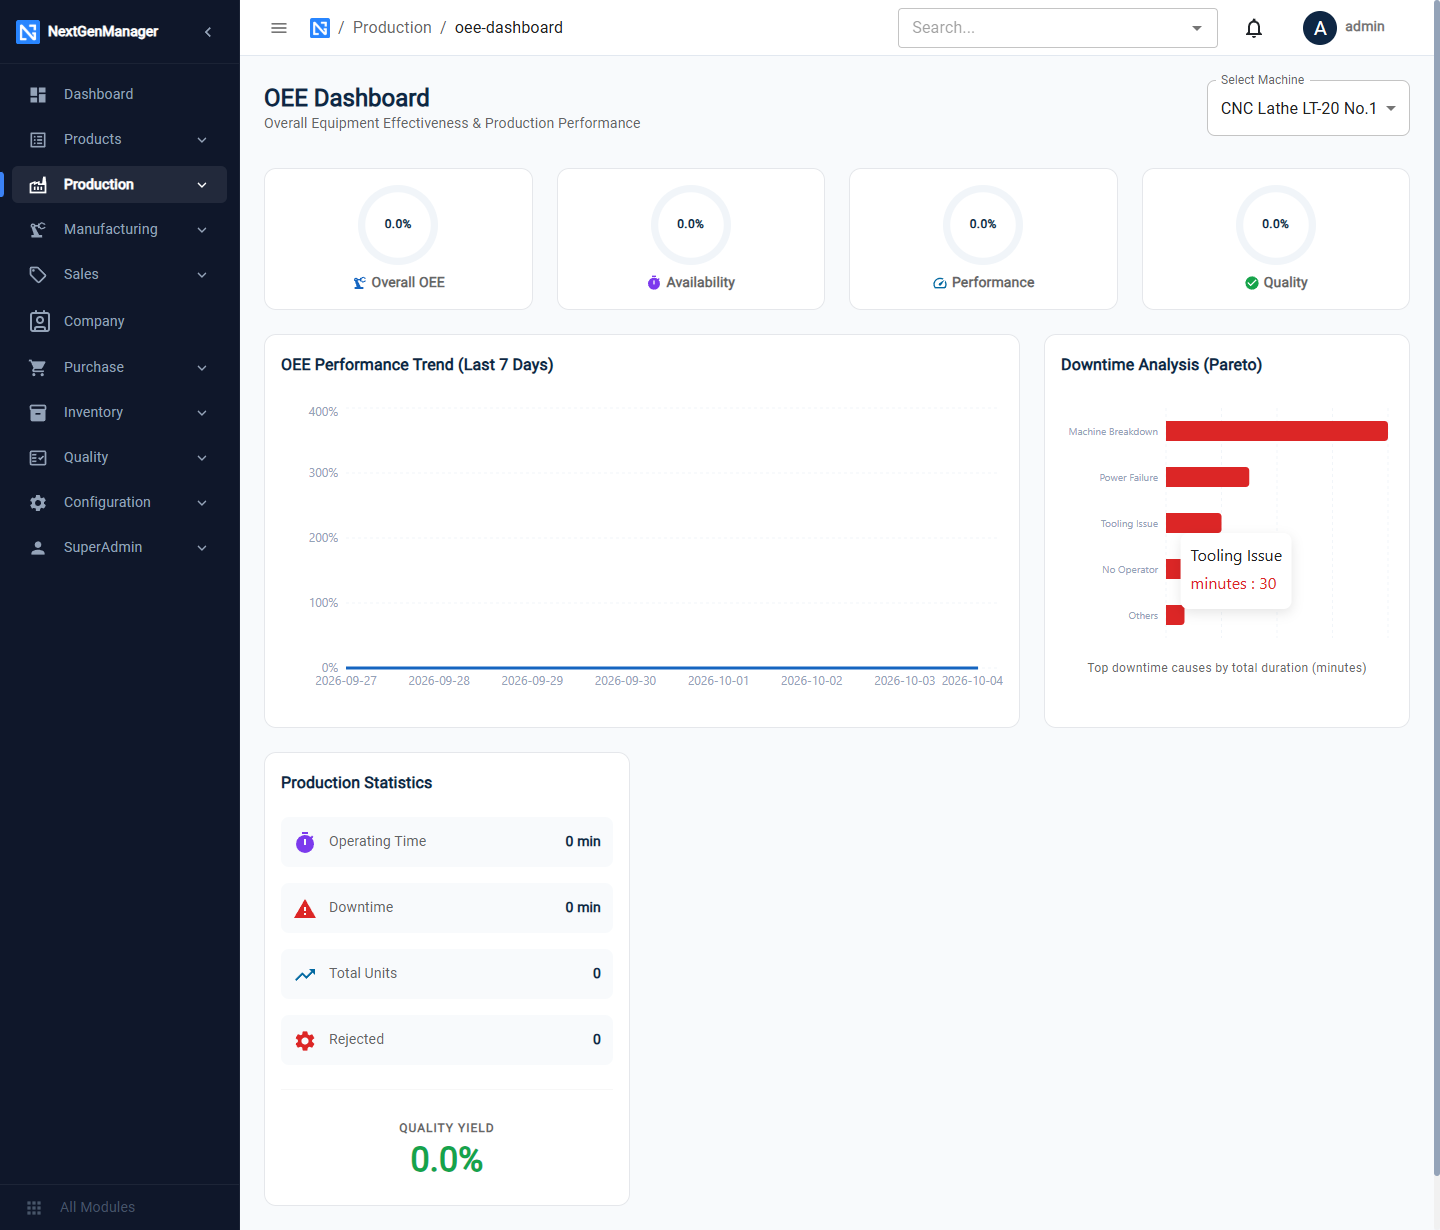
:::note Where the OEE figures come from The dashboard is fed by machine events and production logs recorded against the machine — from the machine's own page (Log Event, Add Log) or from a machine data feed. Output recorded on work-order operations does not appear here. :::